The pitch here is pretty simple: the Core i5 11400F costs around £150/$175, yet its six core and twelve thread design still hits the current sweet spot for gaming and occasional content creation. It’s clocked just 400MHz slower than the Core i5 11600K (4.2GHz vs 4.6GHz for max all-core turbo), and each of its cores ought to be quite powerful, given its modern Cypress Cove design. In the best case scenario, it wouldn’t be outrageous to hope for performance in line with the Ryzen 5000 series - but at a considerably lower asking price than AMD’s £260/$300 entry-level Ryzen 5 5600X. That sounds like the recipe for a value champion, so we were keen to get testing.
As we’re only adding one CPU to our charts, we’ll keep this introductory page brief - after all, you can read our full 11900K and 11600K review for a more detailed write-up of the new features arriving with Intel’s 11th-gen desktop chips and 500-series motherboards.
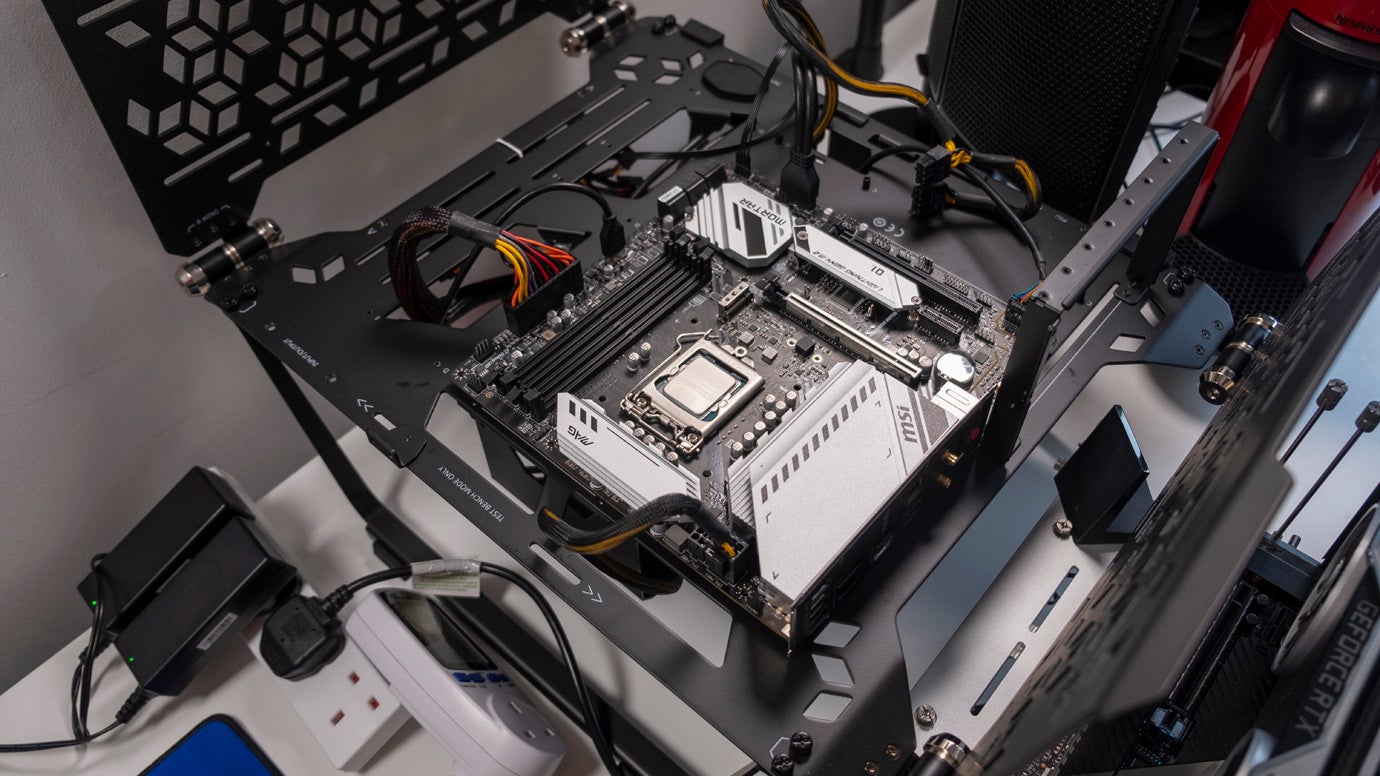
Given that most people won’t be pairing their 11400Fs with a £500+ Z590 motherboard, we’ve swapped in something more price-appropriate for our primary testing: the £150/$175 MSI MAG B560M Mortar WiFi. As with other B560 boards, it supports two major new features: PCIe 4.0 components (storage and graphics cards) and memory overclocking, with the latter previously reserved only for Intel’s highest-end Z-series boards.
This has been paired with an Nvidia GeForce RTX 2080 Ti Founders Edition, two 8GB sticks of G.Skill Trident Z Royal RAM running at 3600MHz CL16, a Gamer Storm 850W 80+ Gold power supply and two coolers - our standard Eisbaer Aurora 240mm AiO for the bulk of our testing, and the Intel box cooler that comes with the 11400F for a few supplemental tests. Windows 10 and our games were installed on a massive 2TB Samsung 970 Evo Plus NVMe SSD from Box. As usual, the latest Windows updates and Nvidia graphics drivers were installed for testing, with the Z590 board using BIOS version 610 and the B560 board using BIOS version 7D17v12.
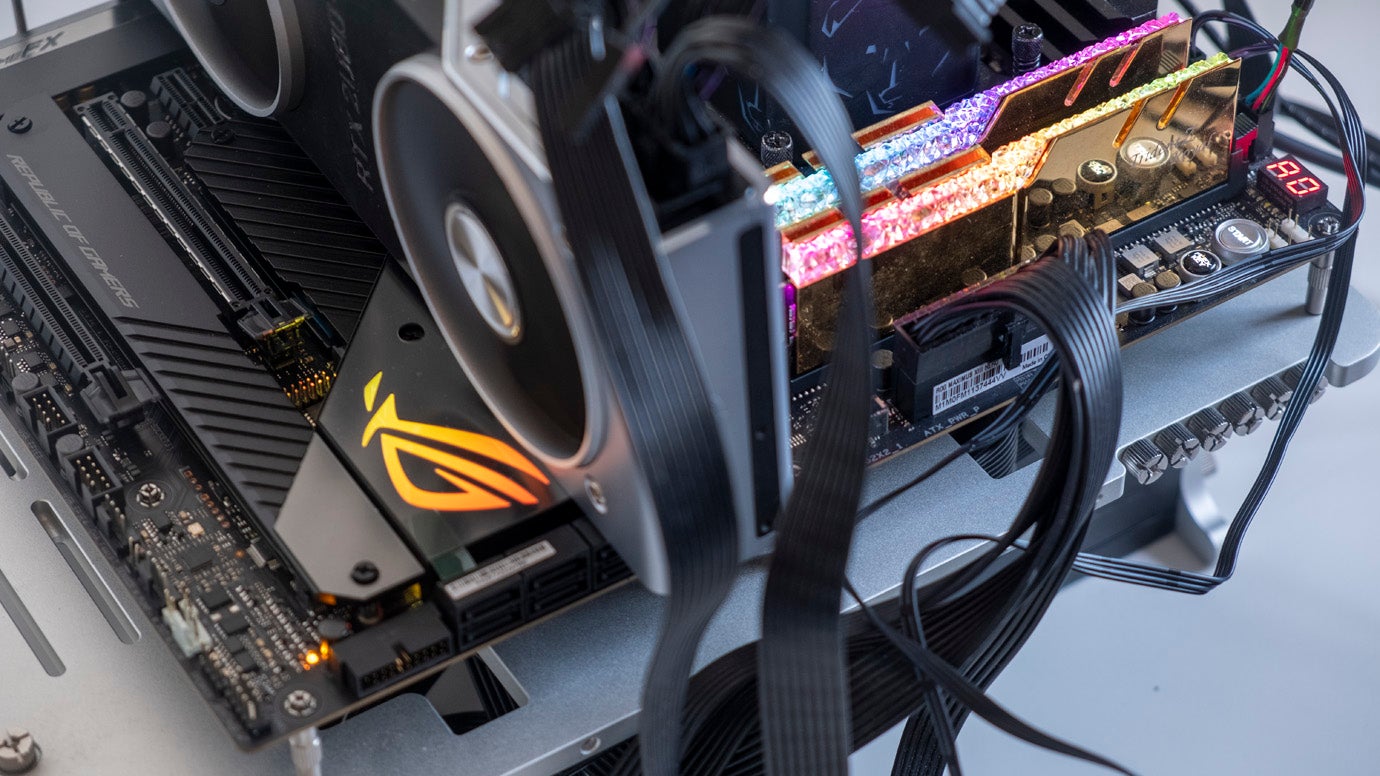
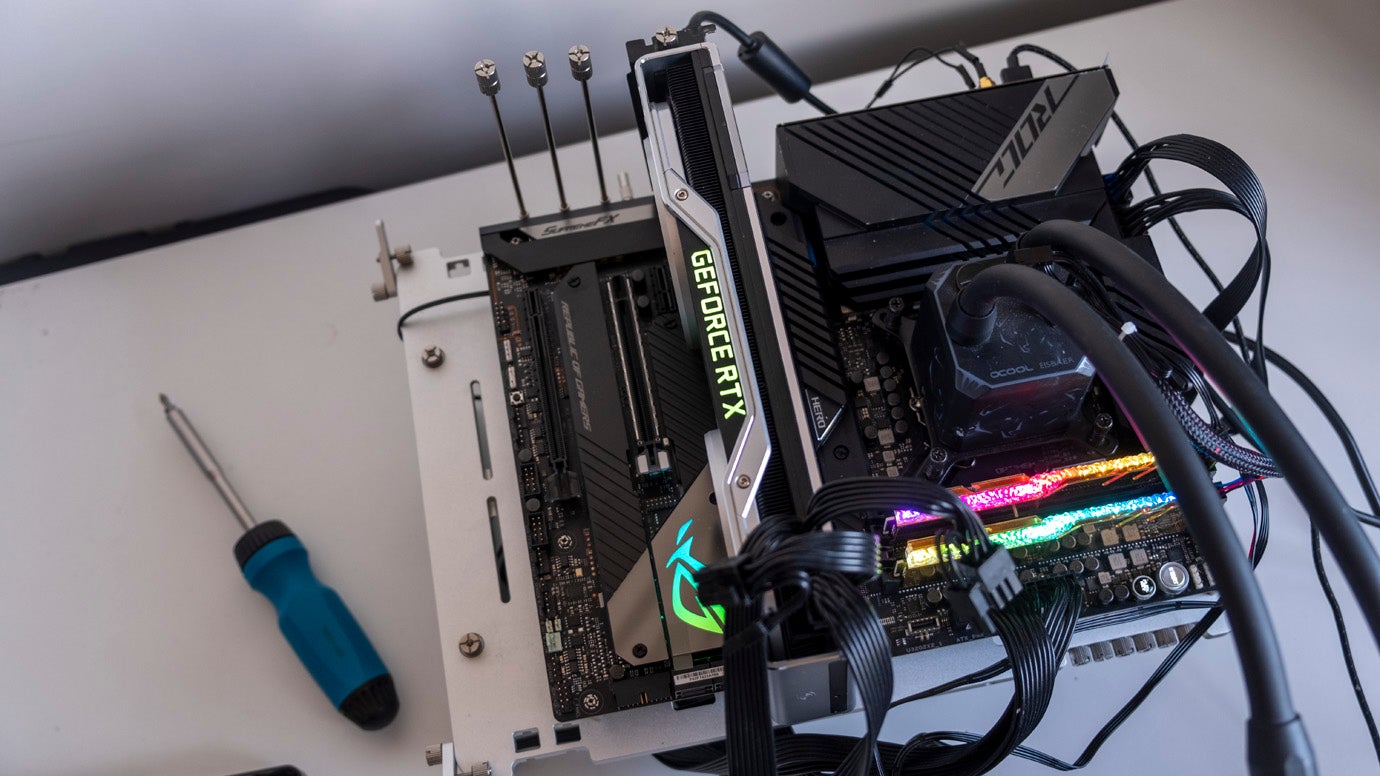
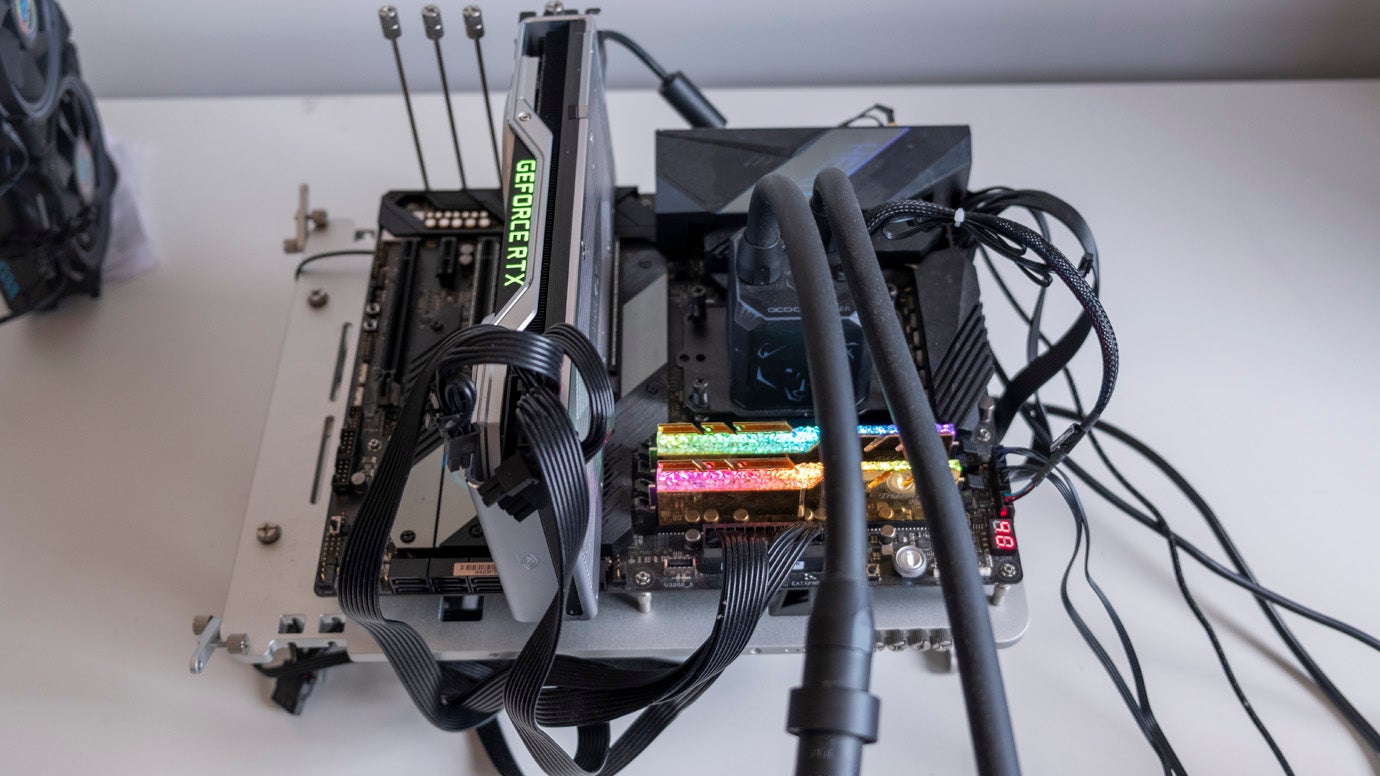
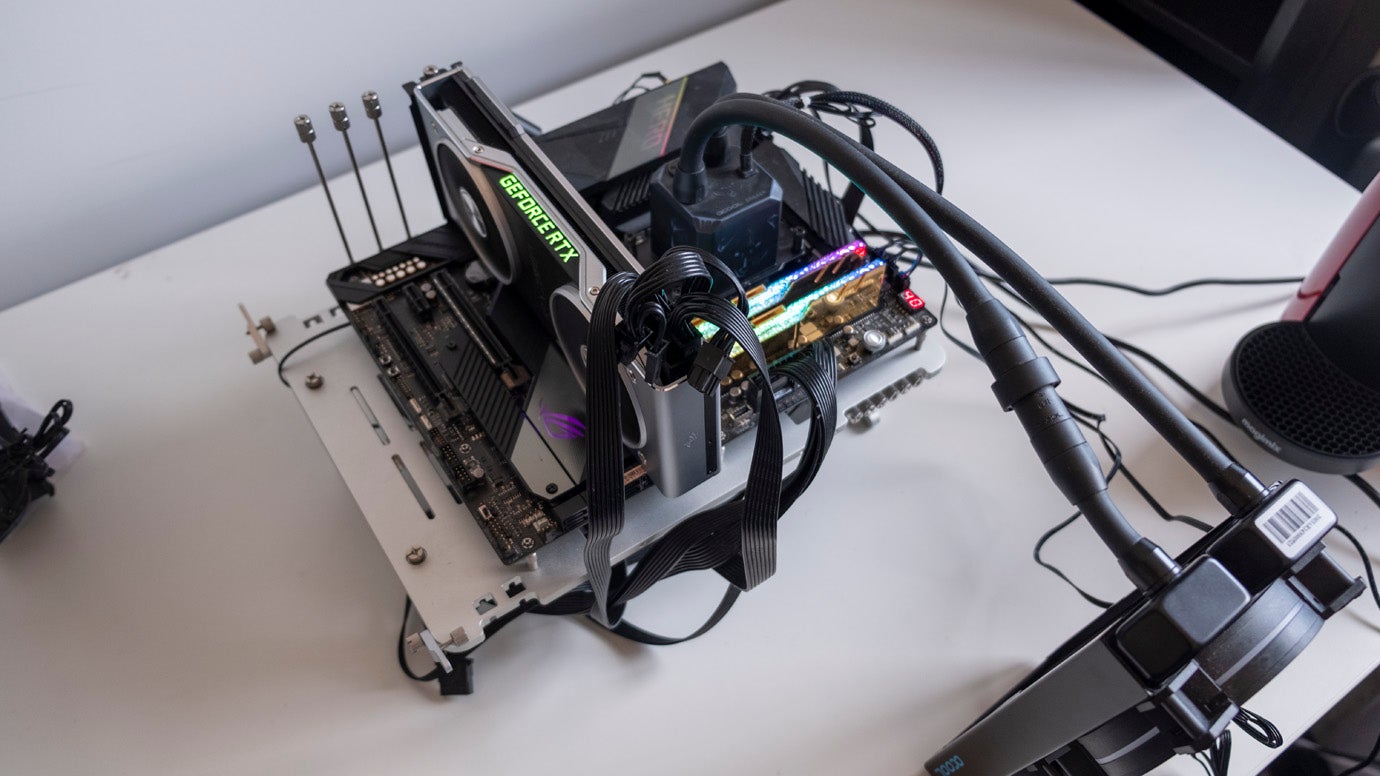
We normally use the excellent OpenBenchTable for testing, but this time we used Cooler Master’s $200 MasterFrame 700. This titanic combination test bench and open-air display case is basically the opposite of the 11400F in every way, and we’ll share a small review of the new test bed at the conclusion to this review.
Before we get into the content creation and gaming benchmark results, a quick note about our RAM setup: non-Core i9 processors technically don’t support RAM faster than 2933MHz if you’re using the ‘Gear 1’ setting in your BIOS, which uses a 1:1 ratio between the memory and memory controller. However, in practice, both the motherboards we tested the 11400F with used 1:1 by default, even on our 3600MHz RAM, so this doesn’t appear to be a part of the Intel guidance that is closely adhered to.
Finally, primary testing was done with power limits effectively removed, which is done by default if you say you have an AiO or high-end air cooler upon first entering the BIOS. This reflects a typical use case scenario where the user will be accepting the default motherboard options to enable extra performance, and matches our previous testing methodology for CPUs. We also performed a handful of tests with the standard box cooler and the default 65W limit, which we’ll cover separately in this review.
So, with that proviso out of the way - content creation. We’ve opted for two relatively brief tests here, to give you the broad strokes of how the 11400F performs for common tasks like 3D rendering and transcoding video from one format to another. The two specific apps are Cinebench R20, a benchmark application that mimics rendering a 3D scene in professional graphics package Cinema 4D, and Handbrake, where we encoded a high-quality Patreon video into h.264 and h.265 (HEVC) formats using the free Handbrake application. We ran the tests twice, once using the box cooler and the default 65W limit, once with the 240mm AiO installed and its 255W power target.
The single-core scores for the 11400F were 538 in both cases (as with the rest of the cores idle, we’re still some distance from that 65W power target). This is a great result, as we’re more or less tied with the Core i9 10900K and considerably beyond the 493 score we recorded for the 11600K. That does mean we’re still around 10 percent slower than the Ryzen 5600X and Core i5 11600K, but that’s a tighter margin than I expected and shows the IPC advantage that Intel has been able to find with their 11th-gen designs.
Moving onto multi-core now, and here we see a clear difference between the 65W and 255W modes. The box cooler provides a decent score of 3600, but the unlimited power result is about 10 percent faster at 3959. For reference, that puts the 11400F just ahead of the 10600K at 3587, and just behind the Ryzen 3600X at 3705. The Ryzen 5600X is significantly faster at 4446, but this CPU costs nearly twice as much. (By the way, we also ran Cinebench R20 with the box cooler and the power limits disabled, which resulted in a multi-core score of 3953 - so at least for relatively short workloads, the box cooler is enough to keep CPU temperatures in check at the expense of relatively high noise levels.)
The Handbrake encoding results show a similar spread, with the 11400F gaining around 15 to 20 percent when it’s unfettered by its 65W TDP. Its 28.47fps result in the H.264 encoding test puts it ahead of the 10600K once again, and only nine percent behind the Core i5 11600K and Ryzen 5 5600X. (It’s also basically tied with the 9th-gen i7!)
In HEVC encoding, the 11400F is nearly 10 percent faster than its closest Ryzen competitor, the 3600X, but it does consume more power at its peak: 242W was the highest full system readout we saw, compared to 149W for the 3600X (which was of course using a different motherboard, so don’t read into that too much.) With Intel’s default power limits enabled, the 11400F system maxed out at 207W, dropping to 150W once the turbo limit expired. So AMD retain the power efficiency lead, but the 11400F at least uses far less power during HEVC encoding than the 11900K.
With the content creation workloads completed, it’s time to turn our attention to games. We tested the 11400F in nine games, including six titles that were introduced with our 11900K and 11600K review earlier this year. Choose your adventure from the options below, or simply click on the Next button to move onwards.
Intel Core i5 11400F analysis
Introduction, hardware breakdown, test system [This Page] Gaming benchmarks: Flight Simulator 2020, Hitman 3, Total War Three Kingdoms Gaming benchmarks: CS:GO, Rainbow Six Siege, Black Ops Cold War Gaming benchmarks: Cyberpunk 2077, Far Cry 5, Crysis 3 Gaming benchmarks: Memory bandwidth analysis Intel Core i5 11400F: the Digital Foundry verdict
